Your income tells only part of the story. Use this home affordability calculator to combine your salary, monthly debts, and down payment savings to estimate how much home you can realistically afford.
Your Info:
Loan info
6.5
%
Other Costs
How this home affordability calculator works
This calculator estimates your realistic home buying power by balancing your income, debts, and mortgage terms to find a comfortable monthly payment. It uses a standard 36% debt-to-income (DTI) ratio benchmark to gauge affordability. The final estimate considers your pretax income, existing debt load, down payment, chosen loan rates and terms, plus ongoing property costs like taxes and insurance.
Uses your income, debts and expenses to estimate a debt-to-income ratio
Assumes a fixed-rate mortgage with level monthly payments over the full term
Includes estimates for property taxes, insurance, HOA fees and PMI if provided
Does not account for closing costs, maintenance, repairs or future income changes
Tip: Treat this as a starting point, not a final approval amount. Before you make an offer on a home, talk with a lender or mortgage broker to get preapproved and confirm how much you can safely borrow.
Your Info:
Enter your details to see how much house you can afford
Fill in your income, monthly debts, expenses, down payment, interest rate and loan term to estimate an affordable home price and monthly mortgage payment.
Tip
Make sure all fields are filled in with realistic values for your situation. If you’re not sure about property taxes, insurance or HOA fees, start with estimates and adjust as you learn more.
Home affordability calculator results are estimates for general informational purposes only and are not financial, lending, legal, or tax advice. This tool is not a mortgage quote, offer to lend, pre-approval, or credit decision. Estimates are based on the information you enter and certain assumptions and may not reflect your actual costs or eligibility, including closing costs, lender fees, maintenance/repairs, utilities, or changes to taxes/insurance/HOA/PMI. Actual loan amounts, rates, down payments, and approval decisions are determined by individual lenders based on your full application and credit profile and are not guaranteed. Review your budget carefully and consult a qualified mortgage professional before making decisions.
How the Calculator Works
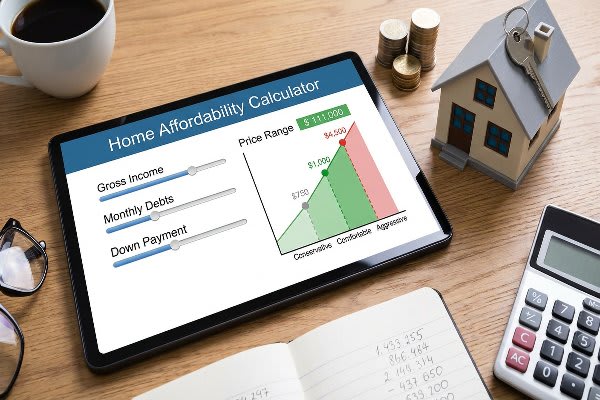
Most tools give you a single number, but home affordability is a range, not a line. This calculator uses your gross household income, existing monthly debt (car payments, student loans, credit cards), and available down payment to show three price points: a conservative estimate, a comfortable middle ground, and an aggressive maximum. This matters because what a lender approves and what fits your budget can be very different.
Here’s what the calculator considers:
Income: Your gross household income before taxes.
Debts: Monthly obligations like auto loans, student loans, personal loans, and credit card minimums.
Down payment: How much cash you plan to put down on the home.
Homeownership costs: Estimated property taxes, homeowners insurance, and, where applicable, HOA dues.
You can also adjust the interest rate, loan term, and taxes and insurance to better match your target area and the quotes you receive from lenders.
Where the Numbers Come From
Mortgage rate: The calculator’s interest rate field defaults to an example rate for illustrative purposes. Your actual rate depends on factors like credit score, debt levels, loan type, and down payment size, and borrowers with stronger credit profiles generally qualify for lower rates.
Homeownership costs: Property tax and insurance fields default to broad averages, but these costs can vary widely by state and city. Adjusting these inputs to match your local market will give you a more accurate monthly payment estimate.
Monthly obligations: Lenders mainly look at debts that show up on your credit report, but your real‑life budget also includes expenses like childcare, groceries, subscriptions, and retirement contributions. Adding some of these ongoing costs to the “debts” field can give you a more realistic picture of what you can comfortably afford.
The 28/36 Rule and DTI
The calculator uses a 36% total debt‑to‑income (DTI) ratio as its default affordability guardrail, based on the common 28/36 guideline. That rule suggests:
No more than 28% of gross monthly income on housing costs (mortgage, taxes, insurance, HOA).
No more than 36% on total monthly debt payments, including housing.
For example, with a gross monthly income of 7,000, 28% is 1,960 for housing and 36% is 2,520 for total debt. If your non‑housing debts are 600 per month, that would leave around 1,920 for a mortgage payment under the 36% guideline.
Many financial planners now prefer even more conservative benchmarks, such as keeping housing around 25% of take‑home pay to leave room for savings, childcare, healthcare, and other priorities.
What Lenders Look At
Lenders focus heavily on DTI because it helps predict the likelihood of on‑time payments. They typically calculate:
Front‑end DTI: Housing costs divided by gross monthly income, often capped around 28% for conventional loans.
Back‑end DTI: Total monthly debt (including housing) divided by gross monthly income, commonly capped near 43%, with some flexibility for strong applicants.
Beyond ratios, lenders also consider:
Cash reserves: Savings left after closing, often measured in months of mortgage payments.
Employment history: Consistent income over the last two years in the same field.
Credit profile: Credit score and how much of your available credit you use.
Down payment and its source: How much you put down and whether funds are your own savings or documented gifts.
Costs the Calculator Can’t Fully Capture
First‑time buyers often underestimate ongoing homeownership costs that sit outside the mortgage payment. To avoid surprises, plan separately for:
Maintenance and repairs: A common rule of thumb is about 1% of the home’s value per year, with older homes often needing more.
Utilities: Heating and cooling a larger space typically costs more than renting, especially in extreme climates.
HOA dues: Monthly association fees and potential special assessments can change over time.
Transportation: Longer commutes or additional vehicles can significantly increase annual costs.
Many people use their calculator result as a ceiling rather than a target. Choosing a less expensive home may help leave room in your budget for goals like retirement contributions, emergency savings, and other priorities, depending on your individual circumstances.
Written byBestmoney Staff
The BestMoney editorial team is composed of writers and experts covering a full range of financial services. Our mission is to simplify the process of selecting the right provider for every need, leveraging our extensive industry knowledge to deliver clear, reliable advice.


.20201102074454.png)

